
October 9, 2025
Modern SaaS platforms generate enormous amounts of telemetry, usage logs, and product event data — yet most of it stays locked in dashboards only a few people understand. Product managers and engineers waste hours digging through Looker, BigQuery, or Grafana to find actionable insights. Meanwhile, end-users remain blind to data that could improve their workflows.
This is the heart of the problem: insight latency — the gap between data generation and action. Every moment that insight stays trapped behind static dashboards slows adoption, onboarding, and optimization.
AI-driven embedded analytics bridge this gap by bringing intelligence to where users already work. Instead of navigating to an analytics page, users can simply ask questions in natural language or see auto-generated visuals inside the same interface. Doc-E.ai operationalizes this idea by embedding an Agentic AI layer that can orchestrate queries, summarize results, and render contextual charts in real time.
Embedded analytics isn’t just about adding charts. It’s about enabling conversation with data — where every data point becomes explorable and explainable. With Doc-E.ai:
This transforms analytics from a pull-based model (where teams go looking for data) into a push-based experience(where insights proactively appear when and where they matter).
The result? Fewer clicks, faster decisions, and dramatically higher engagement.
Traditional BI tools render static graphs — valuable, but fixed. Doc-E.ai’s embedded LLM agents interpret user intent, fetch relevant data from authorized sources (e.g., Looker, BigQuery, Databricks), and generate dynamic, interactive visuals that evolve as users refine their questions.
For example:
Within seconds, the visualization updates — no SQL, no BI training needed.
This accelerates not only adoption of the AI-guided system but also internal alignment. When everyone from product managers to executives can interrogate data visually, decision-making becomes collective and transparent.
Where Doc-E.ai stands apart is in closing the loop between insight and intervention. The same conversational agent that surfaces an adoption gap can trigger workflows — such as nudging users via Slack, updating a dashboard, or launching a guided in-app tutorial.
This creates a continuous improvement cycle:
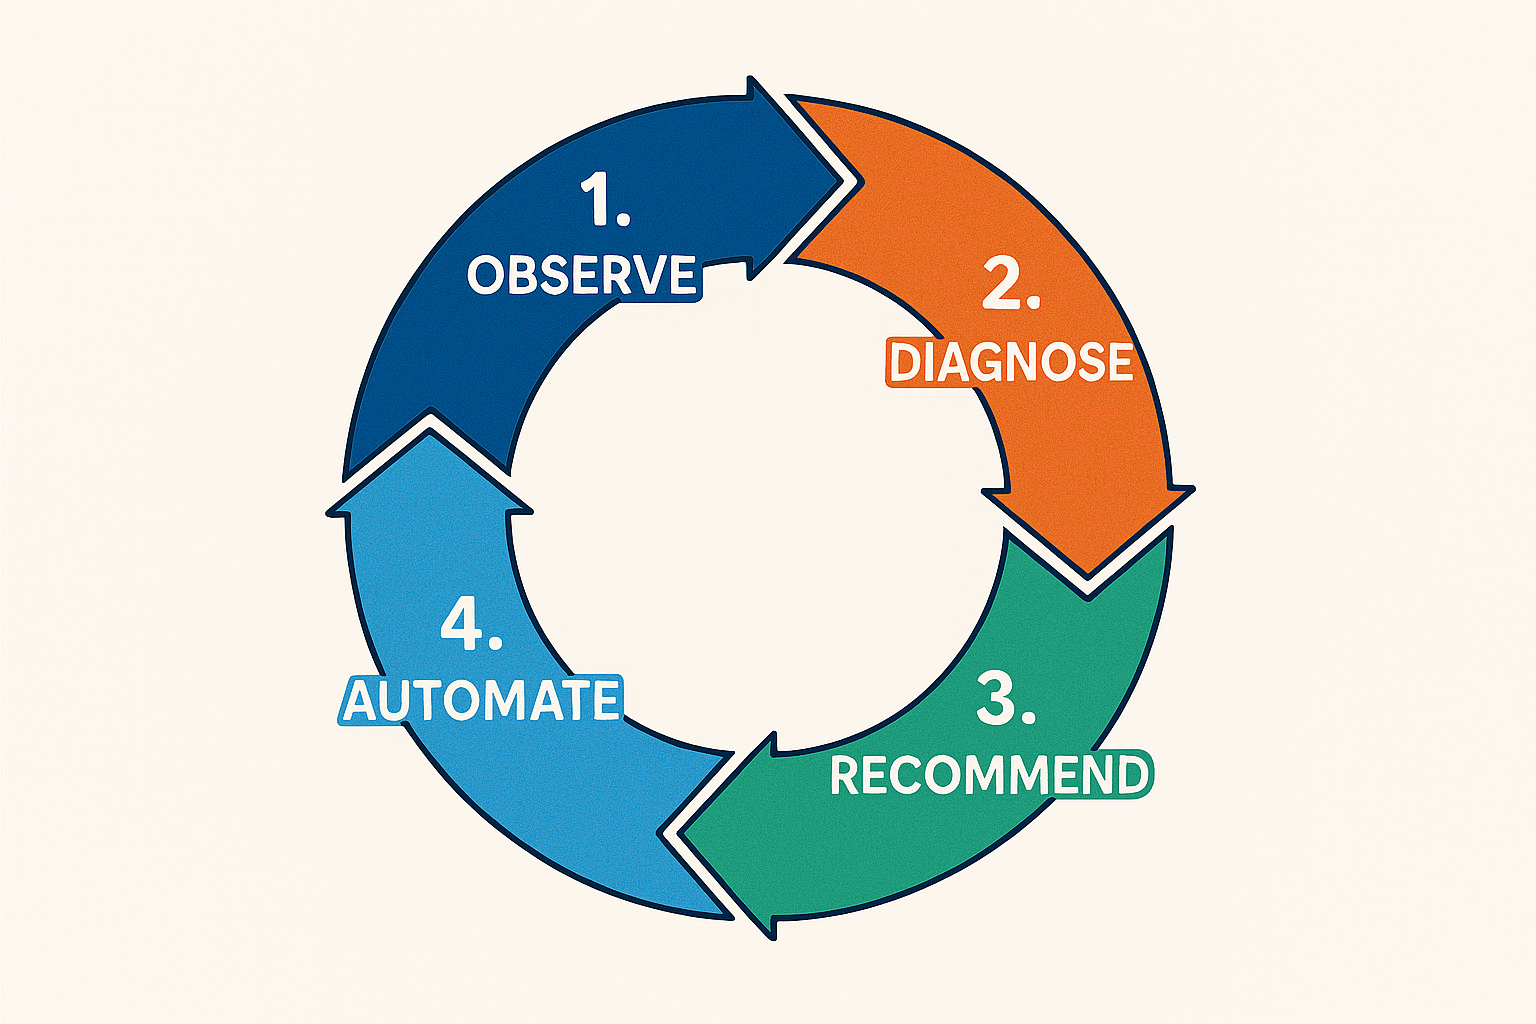
Unlike traditional analytics tools that stop at “observe,” Doc-E.ai extends the experience into guided action, combining analytics, automation, and in-app intelligence into one unified layer.
Unlock the full potential of your in-app analytics.
Book a demo with Doc-E.ai today and experience how conversational, AI-driven visuals can turn every SaaS interaction into an intelligent moment.


